UK HMO Market Data — August 2026
The national monthly picture of the UK room-rental market, built from live SpareRoom advertisements captured between 21 July and 27 August 2026.
National medians by room type
| Room type | Median advertised rent (P50) | Listings (n) |
|---|---|---|
| Double room | £652 pcm | 25,889 |
| Double en-suite | £695 pcm | 6,234 |
| Single room | £600 pcm | 5,165 |
| Studio | £750 pcm | 1,705 |
Medians across all live listings nationally, furnished rooms with 7-day availability. London weekly rents converted to monthly (×4.345) before aggregation; 3,602 listings converted.
Where rooms cost most — double room, August 2026
| District | Town | Median (P50) | n |
|---|---|---|---|
| EC1 | East Central London | £1,104 | 100 |
| N6 | North London | £956 | 21 |
| NW8 | North West London | £956 | 92 |
| W1 | West London | £912 | 81 |
| N1 | North London | £900 | 202 |
…and where they cost least
| District | Town | Median (P50) | n |
|---|---|---|---|
| E20 | East London | £398 | 40 |
| AB24 | Aberdeen | £420 | 33 |
| HD1 | Huddersfield | £430 | 18 |
| HU6 | Hull | £433 | 8 |
| L20 | Liverpool | £435 | 8 |
Ranked by median double-room rent; districts with at least 8 double listings shown (quartiles not shown below 8 listings).
UK rent map
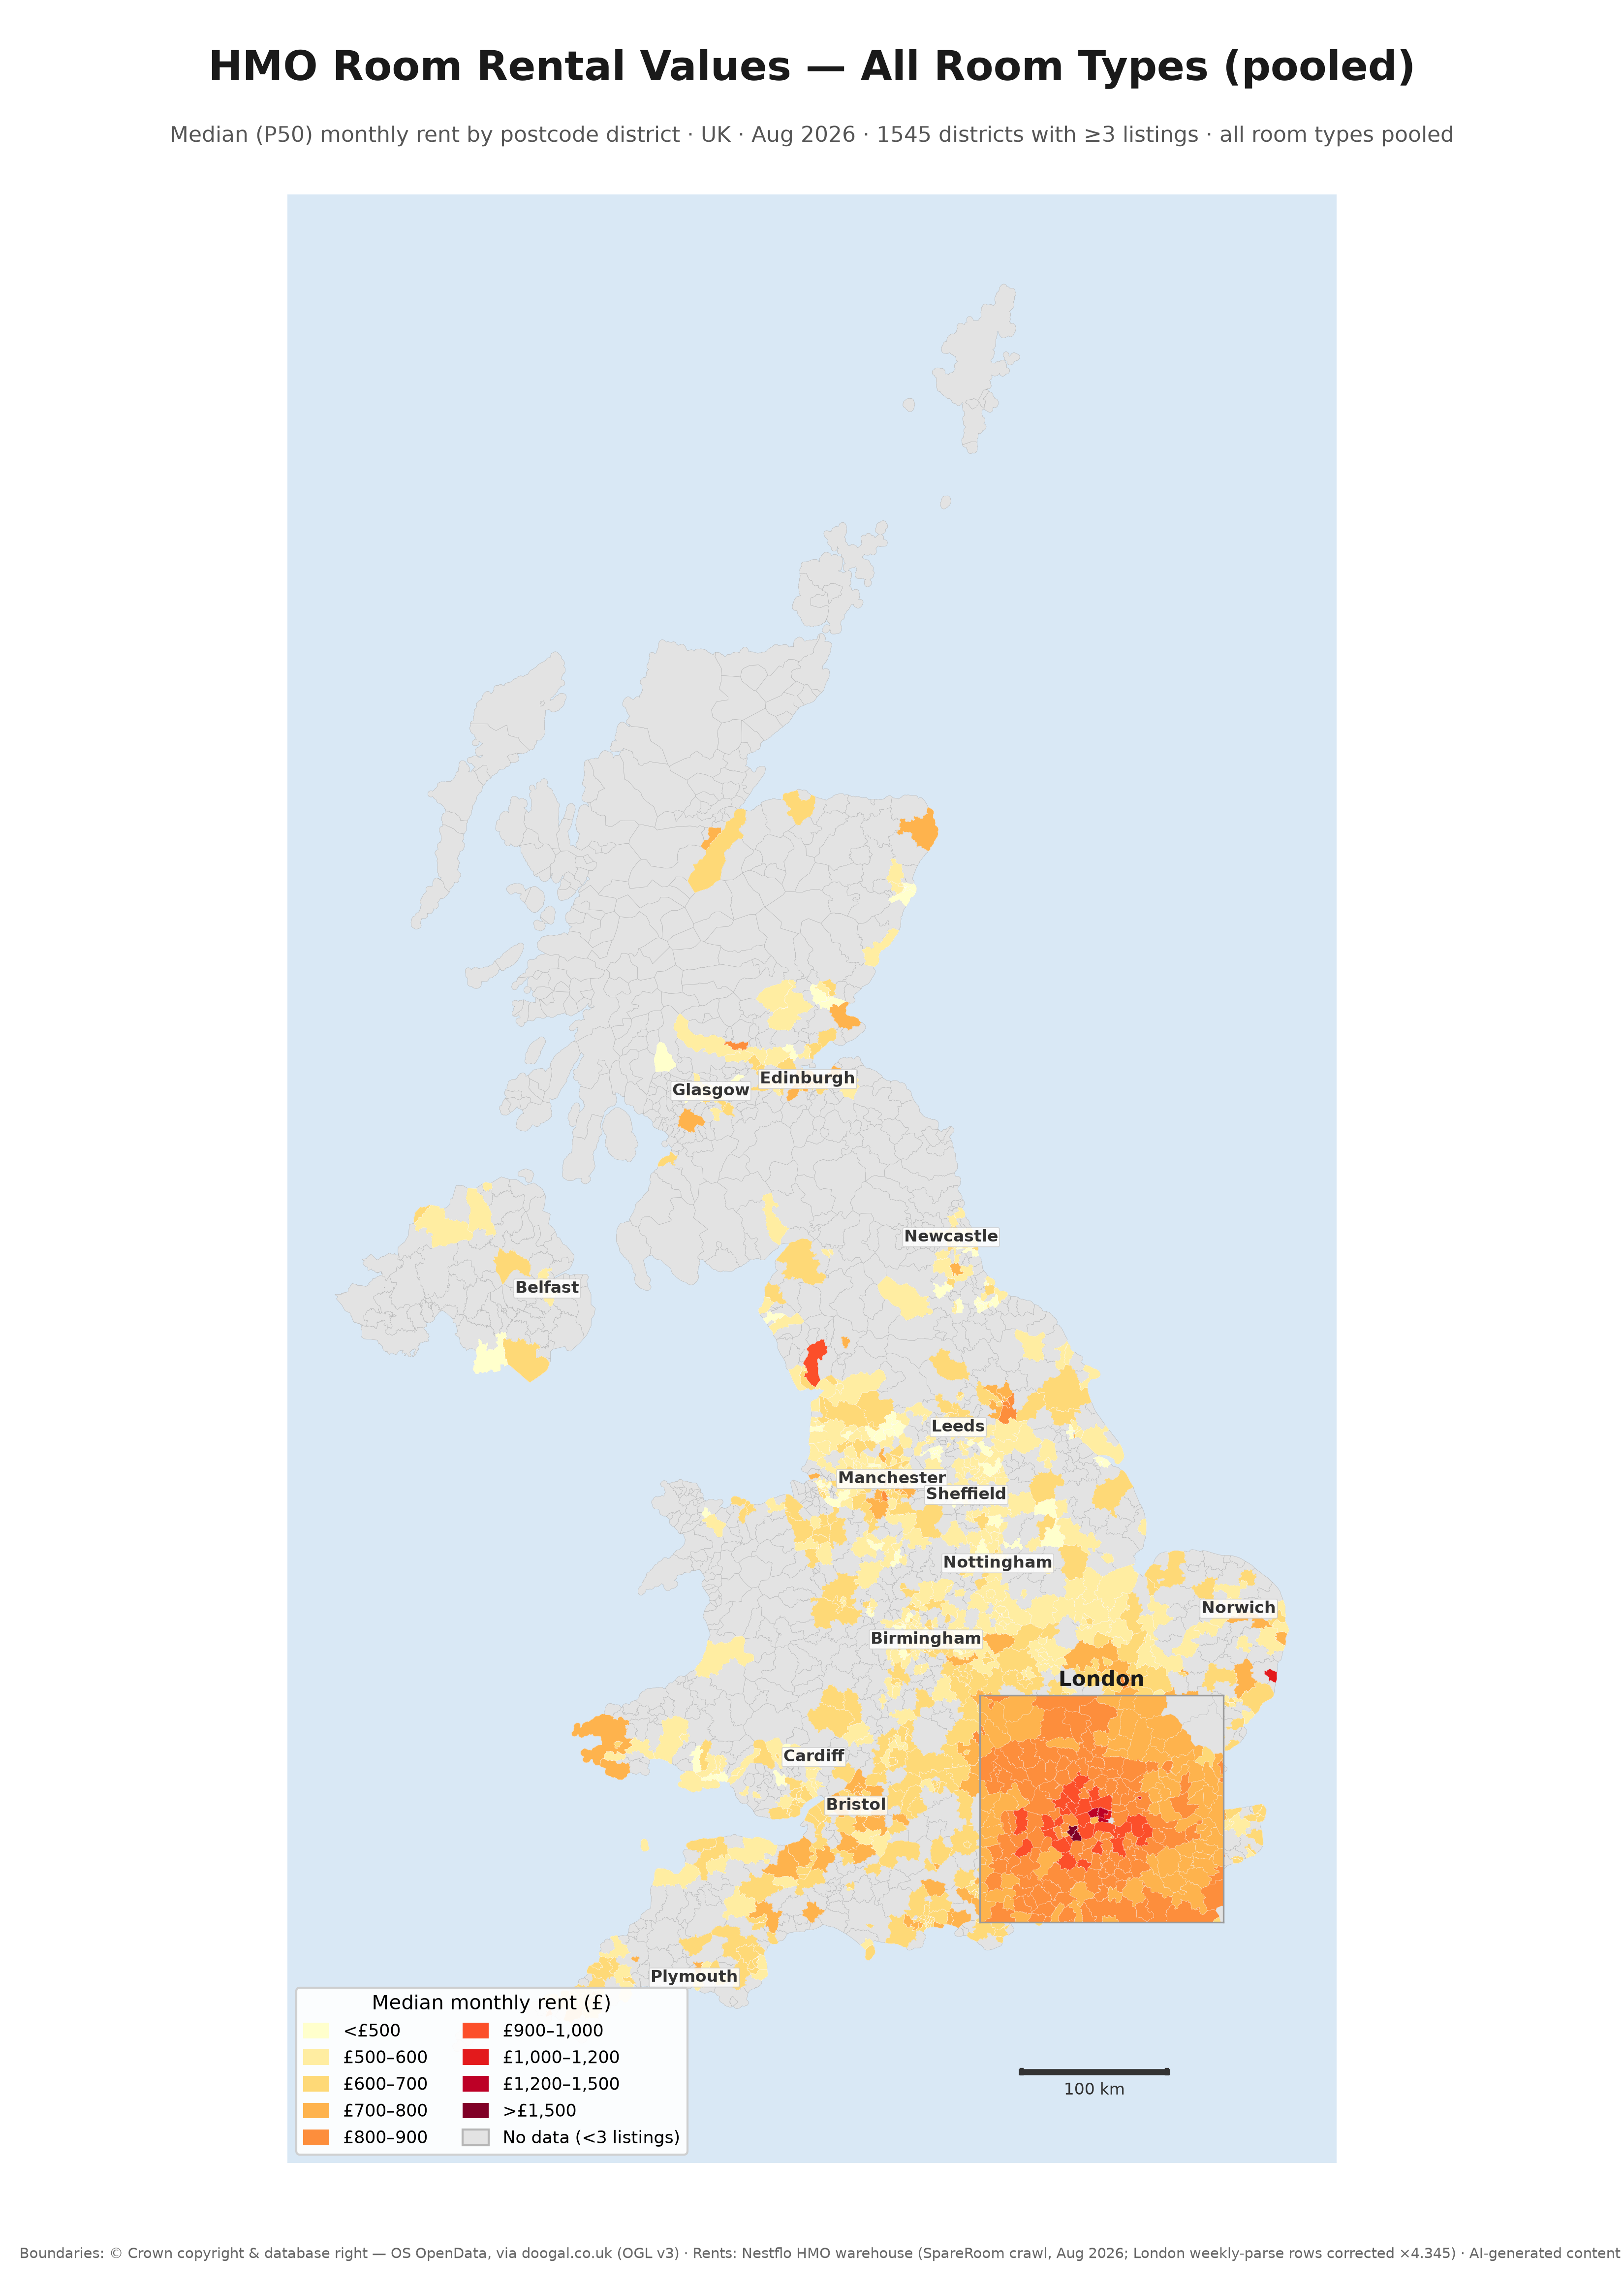
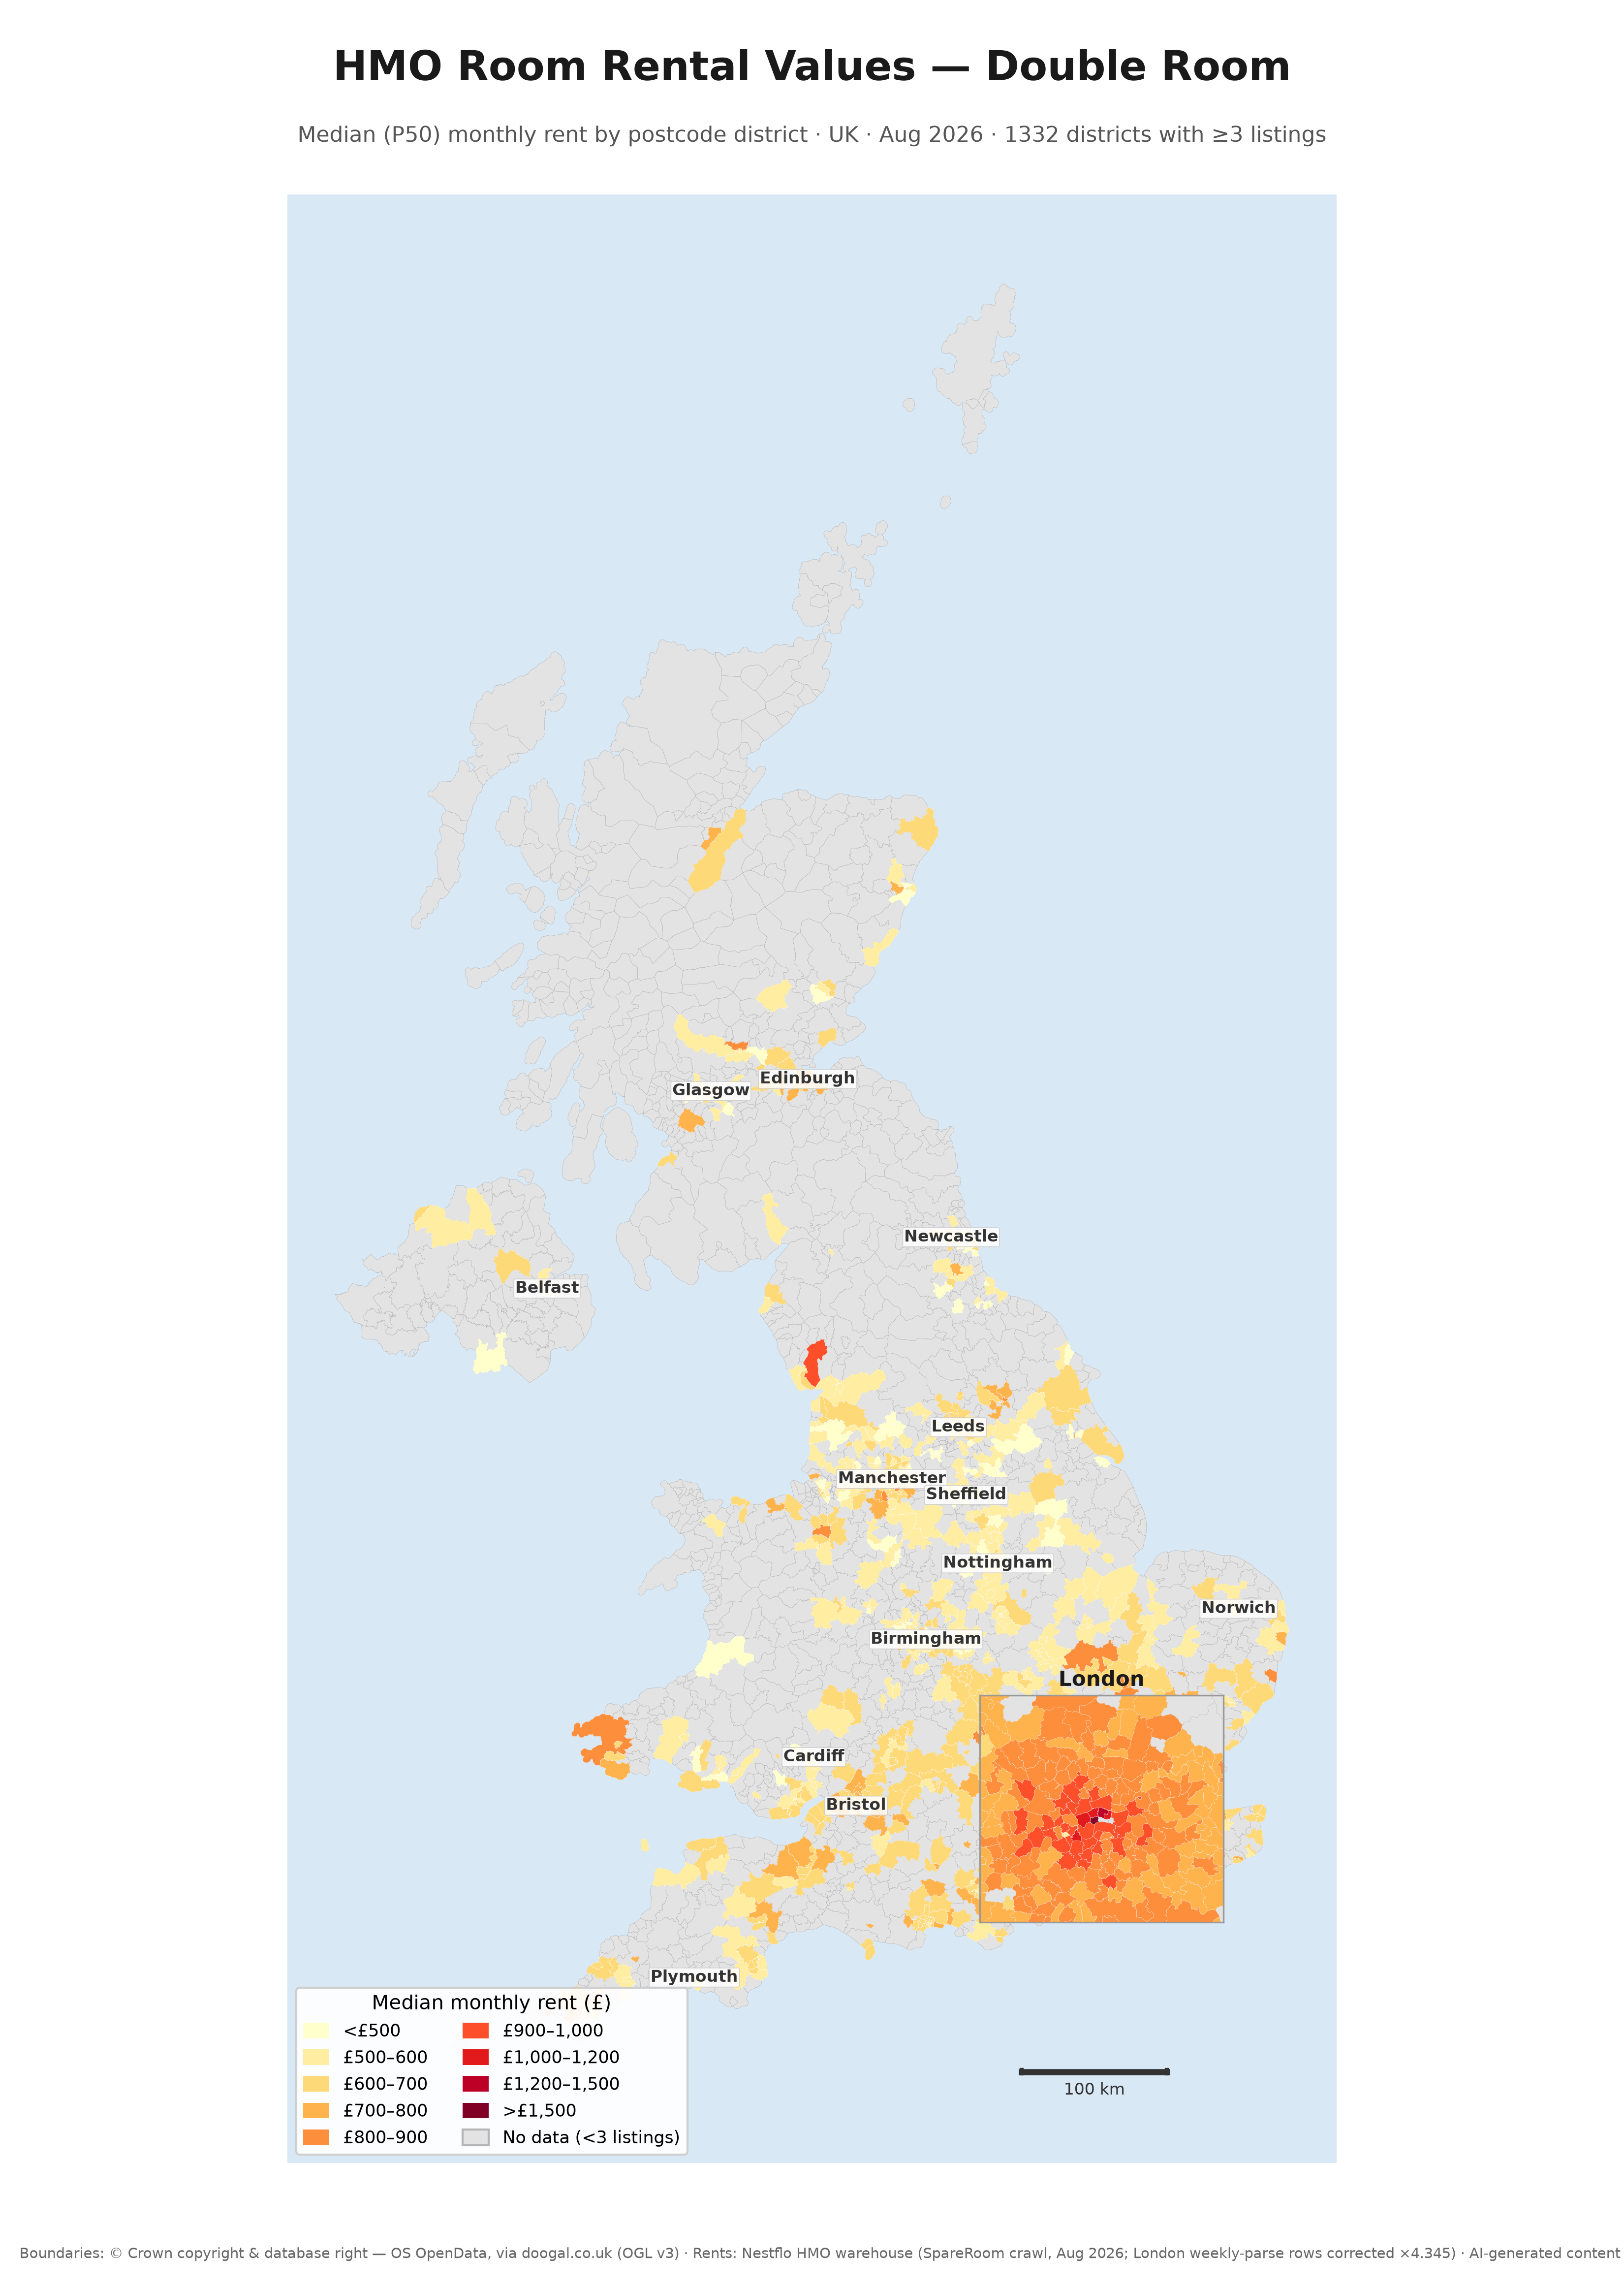
Left: all room types pooled. Right: double rooms. Deeper room-type maps (single, en-suite, studio) and the interactive map are available on request.
Market character
Move-in lead time: 65.6% of live ads offered immediate move-in — an advertising lead-time indicator, not a vacancy rate.
Who advertises: 23.9% agencies / 76.1% private landlords.